Tutorial: COVID-19
In this tutorial you will learn how to use several widgets from Charts package. You also will learn how to use such scientific method as modeling on the example of modeling COVID-19 spreading.
Introduction
Modeling is an essential part of a science. It is not always possible to calculate outcome using simple formula. In this case modeling comes to help. When modeling we just calculate small parts using average formulas. The less parts are the more accurate final result will be (usually). In this tutorial we are going to use something like this. We are going to calculate spreading of the COVID-19 infection day by day using some starting parameters. Although this method can be applied to any contagious disease, we will use known COVID-19 parameters, which you may change to needed for you ones later.
We are not going to make 100% accurate modeling. Moreover, our modeling won't include a lot of parameters and conditions and will be just an average calculation. Nevertheless, even such an inaccurate modeling shows realistic result especially on big numbers. So, here is some of the assumptions we are going to make in out calculations.
- Disease goes the same way for all people. Its just like we average it.
- People can't get sick second time, which we are already know is not true.
- People don't die from it. Adding death rate to our modeling will actually change nothing due to previous assumption.
- There is always a place in a hospital for a sick person. Medical system never collapses.
- Seasons, weather, weekends, and so on doesn't affect how virus spreads.
- Government do nothing to prevent spreading.
- No new people arrive and no ones leave the place were infection is.
Having all those assumptions we need only a few initial parameters. First of all we need to know number of people we are going to model disease spreading amongst and how many are already infected at the beginning of modeling. Next, we need to know how disease behaves: how many days pass from infection until person becomes contagious, how many days person is contagious before it gets sick and go to a hospital or stays home and stops spreading the virus, and how many days pass till person becomes well again. And a final and important parameter is how many people (in average) one infected person infects (infectious).
Now we know which parameters we need to take into calculations. Lets decide what are we need to get as a result. It would be interesting to see how many people caught the infection each day, how many people are sick and get well again. And it is important to see how infectious rate changes day by day.
Lets now go to creating an application. Create project with form as usually.
Form layout
We are going to have some inputs to change initial parameters at the form right and several charts in the rest form's space.
Lets now create a form which will look like the one on the image below.
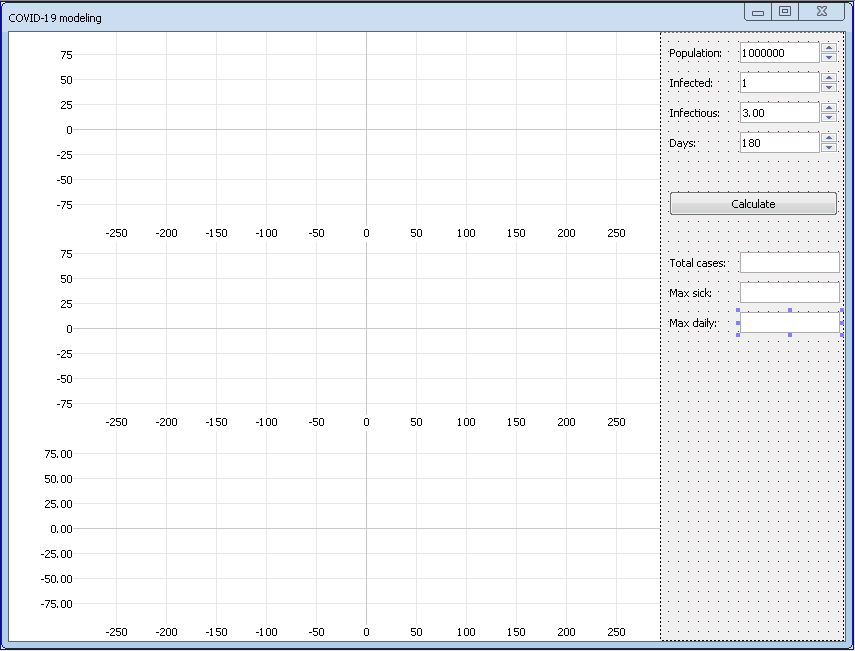
To create such a form do the following.
- Change form's Name property to FormMain.
- Change form's Caption property to COVID-19 modeling.
- Change form's WindowState property to Maximized.
- Generate name for form's event called OnResize.
- Add widget Container to the form.
- Change widget's Align property to Right.
- Change widget's UseMask property to false.
- Add widget Label to the container.
- Change widget's Caption property to Population:.
- Add widget Edit to the container.
- Change widget's Name property to EditPopulation.
- Add widget UpDown to the container.
- Change widget's Name property to UpDownPopulation.
- Change widget's Min property to 10000. Such method of modeling works the better the bigger population. It has no sense on small populations.
- Change widget's Max property to 50000000.
- Change widget's Value property to 1000000.
- Change widget's AssignedTo property to EditPopulation.
- Add widget Label to the container.
- Change widget's Caption property to Infected:.
- Add widget Edit to the container.
- Change widget's Name property to EditInfected.
- Add widget UpDown to the container.
- Change widget's Name property to UpDownInfected.
- Change widget's Min property to 1.
- Change widget's Max property to 1000000.
- Change widget's AssignedTo property to EditInfected.
- Add widget Label to the container.
- Change widget's Caption property to Infectious:.
- Add widget Edit to the container.
- Change widget's Name property to EditInfectious.
- Add widget UpDownEx from Additional tab to the container.
- Change widget's Name property to UpDownExInfectious.
- Change widget's Min property to 1.
- Change widget's Max property to 10.
- Change widget's Signs property to 2.
- Change widget's Step property to 0.01.
- Change widget's Value property to 3.
- Change widget's AssignedTo property to EditInfectious.
- Add widget Label to the container.
- Change widget's Caption property to Days:.
- Add widget Edit to the container.
- Change widget's Name property to EditDays.
- Add widget UpDown to the container.
- Change widget's Name property to UpDownDays.
- Change widget's Min property to 10.
- Change widget's Max property to 3000.
- Change widget's Value property to 180.
- Change widget's AssignedTo property to EditDays.
- Add widget Button to the container.
- Change widget's Name property to ButtonCalculate.
- Change widget's Caption property to Calculate.
- Generate name for widget's event called OnClick.
- Add widget SplineChart from Charts tab to the form.
- Change widget's Name property to SplineChartMain.
- Change widget's Align property to Top.
- Change widget's ChartLineColors property so that the first color is Gray (it will display total number of cases), the second one is Red (this one is for currently sick people) and the third one is Green (it will be used to show already recovered people).
- Change widget's ChartActivePointSizes property to 0 to draw spline without points.
- Change widget's ChartNormalPointSizes property to 0 to draw spline without points.
- Change widget's LabelPadding property to 64, 32. This adds more space for labels at the left.
- Add widget SplineChart from Charts tab to the form.
- Change widget's Name property to SplineChartInfectious.
- Change widget's Align property to Bottom.
- Change widget's AutoRange property to true, false. We will set required Y range later in source code.
- Change widget's ChartActivePointSizes property to 0 to draw spline without points.
- Change widget's ChartNormalPointSizes property to 0 to draw spline without points.
- Change widget's LabelPadding property to 64, 32. This adds more space for labels at the left.
- Add widget BarChart from Charts tab to the form.
- Change widget's Name property to BarChartCases.
- Change widget's Align property to Client.
- Change widget's BarWidth property to 3.
- Change widget's BorderWidth property to 1 for both states.
- Change widget's LabelPadding property to 64, 32. This adds more space for labels at the left.
- Add widget Label to the container.
- Change widget's Caption property to Total cases:.
- Add widget Edit to the container.
- Change widget's Name property to EditTotalCases.
- Change widget's Text property to empty value.
- Change widget's ReadOnly property to true.
- Add widget Label to the container.
- Change widget's Caption property to Max sick:.
- Add widget Edit to the container.
- Change widget's Name property to EditMaxSick.
- Change widget's Text property to empty value.
- Change widget's ReadOnly property to true.
- Add widget Label to the container.
- Change widget's Caption property to Max daily:.
- Add widget Edit to the container.
- Change widget's Name property to EditMaxDaily.
- Change widget's Text property to empty value.
- Change widget's ReadOnly property to true.
- Put all widgets in the similar position they are on the picture above using drag and drop and arrow buttons (for more precise position and size change).
On the first, top, chart we are going to draw three charts: total cases (gray), currently ill (red), and total recovered (green). On the chart in the middle we are going to show daily new cases. And finally on the bottom chart we will show how infectious rate changes day by day.
We did not add any widgets to edit how many days pass from infection till person become dangerous for people around and others. For simplicity we assume following values and will use them in the code as constants.
- Days from infection till person becomes dangerous to another people: 5.
- Days while person infects another people: 7.
- Days from getting sick to getting better: 14.
Form logic
To draw charts we need to have data for each point of that chart. In our case one point is one day. Besides obvious values like total number of cases, currently sick people, people got recovered and new infections per day we need to store some additional values as well. We will store number of people vulnerable to virus. It's just a total number of people who hasn't got infected yet. We are also going to store a number people who have got infected but not yet infectious and number of people who are infectious. To store all this values we will use a structure.
We also going to add several helper methods. Three methods for updating each of charts and one method which will update specified day statistic.
Create header file with name FormMain.h in the form folder as usually. Put following code into it.
#pragma once

#include "IFormMain.h"

namespace nitisa
{
	namespace app
	{
		class CFormMain :public IFormMain
		{
		private:
			struct Day
			{
				float Vulnerable; // Number of people available to infect
				float Infected; // Number of people infected this day
				float CurrentInfected; // Number of currently infected, but not yet infectious, people
				float CurrentInfectious; // Number of currently infectious people
				float CurrentSick; // Number currently sick, but not infectious anymore, people
				float TotalCases;
				float TotalWell;
			};

			const size_t DAYS_TILL_INFECTIOUS{ 5 };
			const size_t DAYS_TILL_SICK{ 5 + 7 };
			const size_t DAYS_TILL_WELL{ 5 + 7 + 14 };

			float m_fPopulation;
			float m_fInfected;
			float m_fInfectious;
			std::vector<Day> m_aDays;

			void ProcessDay(const size_t index);
			void UpdateMainChart();
			void UpdateCasesChart();
			void UpdateInfectiousChart();
		protected:
			void FormMain_OnResize(IForm *sender) override;
			void ButtonCalculate_OnClick(IControl *sender) override;
		public:
			CFormMain();
		};

		extern CFormMain *FormMain;
	}
}
In the private section we declared struct Day which will be used to store needed values for a day. As you might noticed we use float numbers for number of people. That is not a mistake. We use average values and using floating point numbers is Okay. For example, if we have 0.5 people got infected some day it only means an average value and can be interpreted as one person get infected each two days. We could have used integers of cause but in this case we would need a much more complicated calculations although we would got the same result.
In the m_aDays vector we will store calculation results for each day. After it we declared several constants indicating how many days pass from infection until person becomes infectious, until person becomes ill and until person becomes well again.
In the same folder create source code file FormMain.cpp with the following code.
#include "Platform/Core/Renderer.h"
#include "Platform/Core/Window.h"

#include "Charts/Core/ChartData.h"

#include "FormMain.h"

namespace nitisa
{
	namespace app
	{
		CFormMain *FormMain{ nullptr };

		CFormMain::CFormMain() :
			IFormMain(CWindow::Create(), CRenderer::Create())
		{

		}

		void CFormMain::FormMain_OnResize(IForm *sender)
		{
			float area_height{ ntl::Max<float>(0, (float)getClientHeight()) };
			m_pSplineChartMain->setHeight(area_height / 3);
			m_pSplineChartInfectious->setHeight(area_height / 3);
		}

		void CFormMain::ButtonCalculate_OnClick(IControl *sender)
		{
			m_fPopulation = (float)m_pUpDownPopulation->getValue();
			m_fInfected = (float)m_pUpDownInfected->getValue();
			m_fInfectious = m_pUpDownExInfectious->getValue();
			m_aDays.resize(m_pUpDownDays->getValue());
			m_aDays[0].Vulnerable = m_fPopulation;
			m_aDays[0].Infected = m_fInfected;
			m_aDays[0].CurrentInfected = m_fInfected;
			m_aDays[0].CurrentInfectious = 0;
			m_aDays[0].CurrentSick = 0;
			m_aDays[0].TotalCases = m_fInfected;
			m_aDays[0].TotalWell = 0;
			float max_sick{ 0 }, max_daily{ 0 };
			for (size_t i = 1; i < m_aDays.size(); i++)
			{
				ProcessDay(i);
				max_sick = ntl::Max<float>(max_sick, m_aDays[i].CurrentSick);
				max_daily = ntl::Max<float>(max_daily, m_aDays[i].Infected);
			}
			UpdateMainChart();
			UpdateCasesChart();
			UpdateInfectiousChart();
		}

		void CFormMain::UpdateMainChart()
		{
			m_pSplineChartMain->getDataSet()->DeleteDatas();
			charts::CChartData *total_cases{ new charts::CChartData((int)m_aDays.size()) };
			charts::CChartData *current_sick{ new charts::CChartData((int)m_aDays.size()) };
			charts::CChartData *total_well{ new charts::CChartData((int)m_aDays.size()) };
			for (size_t i = 0; i < m_aDays.size(); i++)
			{
				total_cases->setPoint((int)i, { (float)i, m_aDays[i].TotalCases, L"" });
				current_sick->setPoint((int)i, { (float)i, m_aDays[i].CurrentSick, L"" });
				total_well->setPoint((int)i, { (float)i, m_aDays[i].TotalWell, L"" });
			}
			m_pSplineChartMain->getDataSet()->AddData(total_cases);
			m_pSplineChartMain->getDataSet()->AddData(current_sick);
			m_pSplineChartMain->getDataSet()->AddData(total_well);
			m_pSplineChartMain->Update();
		}

		void CFormMain::UpdateCasesChart()
		{
			m_pBarChartCases->getDataSet()->DeleteDatas();
			charts::CChartData *cases{ new charts::CChartData((int)m_aDays.size()) };
			for (size_t i = 0; i < m_aDays.size(); i++)
				cases->setPoint((int)i, { (float)i, m_aDays[i].Infected, L"" });
			m_pBarChartCases->getDataSet()->AddData(cases);
			m_pBarChartCases->Update();

		}

		void CFormMain::UpdateInfectiousChart()
		{
			m_pSplineChartInfectious->getDataSet()->DeleteDatas();
			charts::CChartData *infectious{ new charts::CChartData((int)m_aDays.size()) }, *line{ new charts::CChartData(2, 0, 1) };
			for (size_t i = 0; i < m_aDays.size(); i++)
				infectious->setPoint((int)i, { (float)i, m_fInfectious * m_aDays[i].Vulnerable / m_fPopulation, L"" });
			line->setX(0, 0);
			line->setX(1, (float)m_aDays.size() - 1);
			m_pSplineChartInfectious->getDataSet()->AddData(infectious);
			m_pSplineChartInfectious->getDataSet()->AddData(line);
			m_pSplineChartInfectious->setYRange(PointF{ 0, m_fInfectious + 1 }); // Update Y range
			m_pSplineChartInfectious->Update();
		}

		void CFormMain::ProcessDay(const size_t index)
		{
			m_aDays[index].Vulnerable = ntl::Max<float>(0, m_aDays[index - 1].Vulnerable - m_aDays[index - 1].Infected);
			m_aDays[index].Infected = m_aDays[index - 1].CurrentInfectious * m_fInfectious / (DAYS_TILL_SICK - DAYS_TILL_INFECTIOUS) * m_aDays[index].Vulnerable / m_fPopulation; // How many people get infected this day
			m_aDays[index].TotalCases = m_aDays[index - 1].TotalCases + m_aDays[index].Infected;
			// Calculate how many people are infected but not yet infectious this day
			m_aDays[index].CurrentInfected = m_aDays[index - 1].CurrentInfected + m_aDays[index].Infected; // Add number of people infected today
			if (index >= DAYS_TILL_INFECTIOUS)
			{
				// Decrease by number of people infected DAYS_TILL_INFECTIOUS days ago
				m_aDays[index].CurrentInfected = ntl::Max<float>(0, m_aDays[index].CurrentInfected - m_aDays[index - DAYS_TILL_INFECTIOUS].Infected);
			}
			// Calculate how many people are infectious this day
			m_aDays[index].CurrentInfectious = m_aDays[index - 1].CurrentInfectious;
			if (index >= DAYS_TILL_INFECTIOUS)
			{
				m_aDays[index].CurrentInfectious += m_aDays[index - DAYS_TILL_INFECTIOUS].Infected; // Increase by number of people got infected DAYS_TILL_INFECTIOUS days ago
				if (index >= DAYS_TILL_SICK)
				{
					// Decrease by number of people infected DAYS_TILL_SICK days ago
					m_aDays[index].CurrentInfectious = ntl::Max<float>(0, m_aDays[index].CurrentInfectious - m_aDays[index - DAYS_TILL_SICK].Infected);
				}
			}
			// Calculate how many people are sick this day
			m_aDays[index].CurrentSick = m_aDays[index - 1].CurrentSick;
			if (index >= DAYS_TILL_SICK)
			{
				m_aDays[index].CurrentSick += m_aDays[index - DAYS_TILL_SICK].Infected; // Increase by number of people got infected DAYS_TILL_SICK days ago
				if (index >= DAYS_TILL_WELL)
				{
					// Decrease by number of people infected DAYS_TILL_WELL days ago
					m_aDays[index].CurrentSick = ntl::Max<float>(0, m_aDays[index].CurrentSick - m_aDays[index - DAYS_TILL_WELL].Infected);
				}
			}
			// Calculate how many people are well again
			m_aDays[index].TotalWell = m_aDays[index - 1].TotalWell;
			if (index >= DAYS_TILL_WELL)
				m_aDays[index].TotalWell += m_aDays[index - DAYS_TILL_WELL].Infected;
		}
	}
}
Constructor is trivial. FormMain_OnResize method is called when the form size is changed. In this method we only resize chart widgets so that all three of them have the same height. The ButtonCalculate_OnClick method, called when user clicks on Calculate button, takes population, originally infected people count and infectious rate from widgets and put them in the corresponding members. We did it to avoid calling widget methods many times as it will be much more slower than getting values directly.
Next, we resize m_aDays to the count of days we are going to process. Put initial values into the members of the first day and run calculation for each day after the first one. ProcessDay() method calculate daily parameters using previous days (as will be explained later). That is why we fill first day values manually. Additionally we get maximum number of sick people and maximum number of new cases to show it below Calculate button. After calculating each day we just call three helper methods to update all three charts and also update widgets showing additional interesting data.
The next three methods for updating charts are very similar and they show standard way of working with chart widgets. Most chart widgets can draw several charts simultaneously. Data for charts are stored in data set, access to which can be done with getDataSet() method. First we remove existing data by calling data set's DeleteDatas() method. Then we create one or more data using helper class CChartData. This class has several overloaded constructors. We use one which allows to specify data size (number of elements in data), which in our case equals to number of days we are modeling. After it we fill data with values we need and add to widget's data set by AddData() method. Widgets from charts package do not update themselves when their data or data set changes. Instead we need to call widget's Update() method. That is how simple updating chart widgets is.
Finally we came to the most interesting method called ProcessDay(). In it we calculate needed values for the day specified by its index and update its information in m_aDays array. At first we calculate how many vulnerable people (number of people who potentially can be infected) we have this day. We need this value for further calculations. The number of vulnerable people equals to the number of vulnerable people previous day minus the number of people got infected previous day. Of cause it cannot be less than zero so we use Max() function to make result non-negative. Next value we update is how many people got infected this day. This value equals to product of the number of infectious people by current daily infectious rate. What is the current daily infectious rate? Lets start from daily infectious rate. We have infectious rate at the beginning which default value we set as 3 and which means how many other people one person infects in average. We divide this value by number of days a person infects other people. That is what we mean by daily infectious rate. In the equation in the code it is m_fInfectious / (DAYS_TILL_SICK - DAYS_TILL_INFECTIOUS). When more people get infected the infectious people meets less vulnerable ones because some of the people one meets are already infected and some are already have immunity because they where infected before and already got well again. That is the m_aDays[index].Vulnerable / m_fPopulation part of the equation. So, the product of these two parts is what we called the current daily infectious rate. To know how many people get sick this day, all we need is to multiply number of currently infectious people by the current daily infectious rate. That is what is done in the second line of the function.
Next we calculate total number of cases which is obvious equals to previous day total number of cases plus number of infected people this day.
The next what we calculate is the number of people who got infected but not yet infectious to another people. This value equals to the number of the same state people previous day plus number of infected people this day and minus number of the people who become infectious. The last member equals to the number of people got infected DAYS_TILL_INFECTIOUS, which equals to 5, days ago. We need here if statement because at the beginning, until we reach day DAYS_TILL_INFECTIOUS we have no infected people and thus we have nothing to subtract. And as earlier we ensure the result wouldn't get negative value. The result we store in CurrentInfected member.
In the same way we calculate how many people become infectious. It equals to infectious people previous day plus number of people who caught infection DAYS_TILL_INFECTIOUS days ago and minus number of people who get sick (went to hospital or left home) and no longer a threat to others. This last member equals to the number of people infected DAYS_TILL_INFECTIOUS days ago. The result we store in CurrentInfectious member. We use if and Max() for the same purpose as before.
In the absolutely the same way we calculate how many people get sick and get well and store results in CurrentSick and TotalWell members respectively. That all the function does.
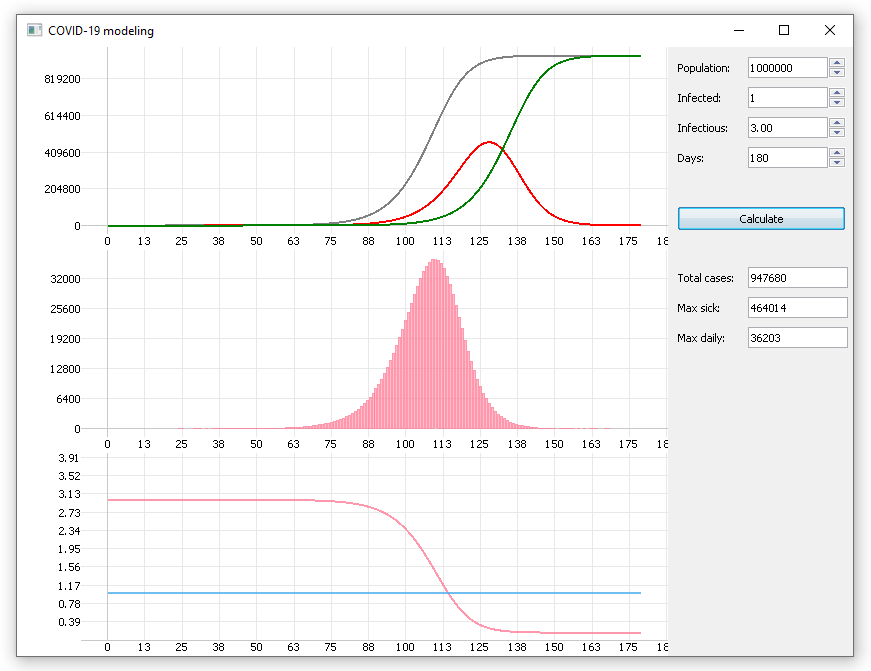
Here you can see how working application looks like.
Conclusion
The purpose of this tutorial is to show how modeling works and teach you something about chart widgets Nitisa has out of box. So we made a lot of assumptions to simplify the modeling. Despite this we still can make some useful conclusions from the results we get. Look at the image above. The first thing you may see is that the disease spreads exponentially at the beginning. Even starting with one person it will not last long. In about 160-170 days it will completely seas to exists for one million population city if do nothing to prevent its spreading but it will affect almost everyone. As you can see in our modeling we've got ~95% of people infected.
Another conclusion is there could be a really huge number of people sick at the same moment. In our case we got almost 50% of population in the edit widget labeled as Max sick. Even if only 3% require hospitalization it means in the such city as ours should be 13-15 thousand vacant beds. Which is a huge amount.
One more thing we can see is that number of daily cases starts decrease when current daily infectious rate is still greater that one. Why do you think it is?
If you wish you may add more parameters, more accurate calculations and model COVID-19 spreading more precise. You even can add such conditions as lock downs, death rate, season influence and so on. It also would be interesting to compare results with what we already know, especially with official charts.
You can find project Covid19 with lots of comments in the latest release of the Nitisa framework in Tutorials\Covid19 folder of the Nitisa solution. To build it you have to select Debug configuration and x86 platform.