SplineChart
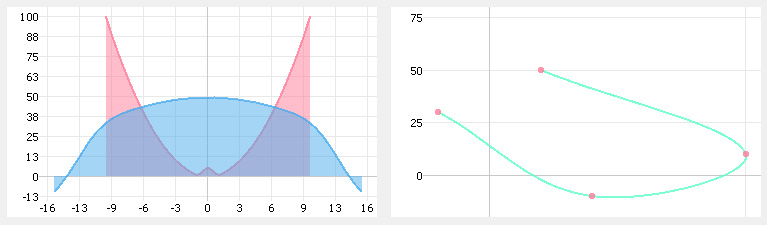
SplineChart widget looks like on the picture below. It can be used to draw data sets as points connected by bezier splines. The drawing accurs between two points in data set so the X-coordinate is allowed to be non monotonic.
This widget use custom renderer assigned to data set.
X and Y coordinate of data points means the same in both vertical and horizontal modes.