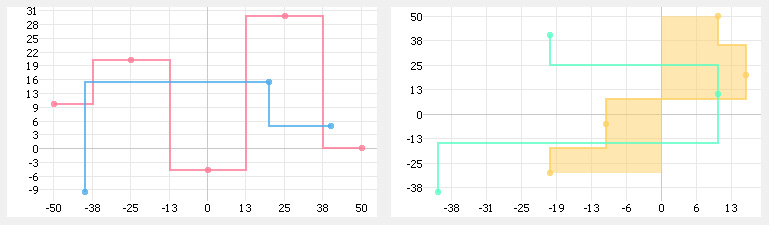
SteppedLineChart
SteppedLineChart widget looks like on the picture below. It can be used to draw data sets as points connected by stright horizontal and vertical lines.
This widget use custom renderer assigned to data set.
X and Y coordinate of data points means the same in both vertical and horizontal modes.