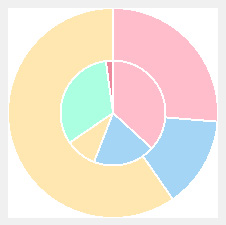
PieChart
PieChart widget looks like on the picture below. It can be used to display data sets in form of pie where each data is represented as a ring (central or last data in set is show with zero inner radius ring) and points of data are represented as parts of the corresponding ring. The more Y value of the point the bigger part of the ring it fills.
This widget doesn't use custom renderer assigned to data set. Thus custom drawing is not supported.
X-coordinate of data points is not used by this widget.