Debugging on Linux
In this short article we are going to show how to setup Visual Studio Code under Linux and debug your applications created with Nitisa framework. This is related to linux applications only.
As you might read in previous article you cannot debug Linux application with graphical interface directly from Visual Studio due to it connects to remove system via SSH. The only way to debug your applications is to debug it directly on Linux machine. When you build your application for Linux platform in Visual Studio it actually builds it on the Linux machine and thus the source code and compiled application itself are also located somewhere on that Linux machine. Moreover, Nitisa source code is also copied to Linux machine and is built there. So, everything we need to debug is already located where we want it and we even don't need to copy anything manually.
Lets see how we can setup Visual Studio Code to debug Linux application created with Nitisa framework. But first lets see where the source code and compiled binary files are on the Linux machine. If you see at the Linux application project settings, you might see something like this.
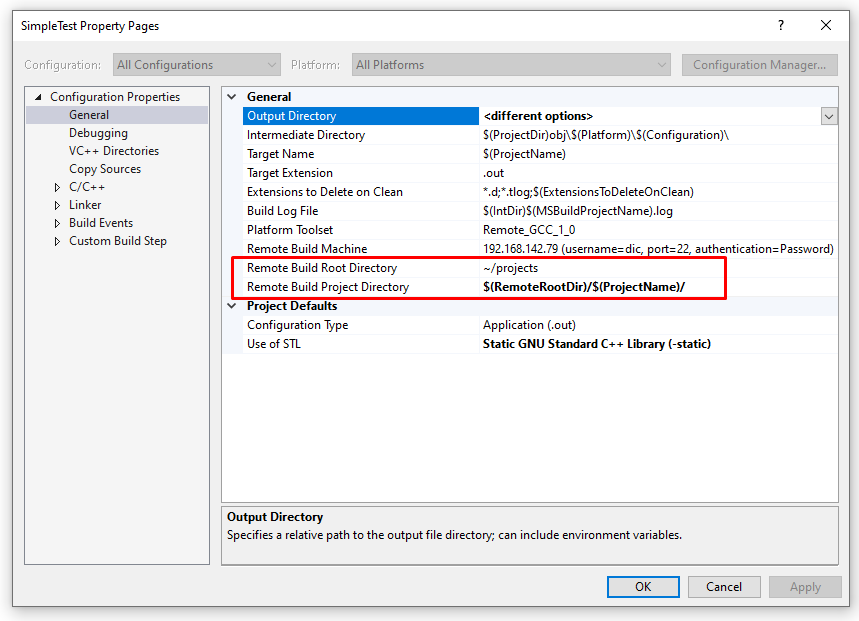
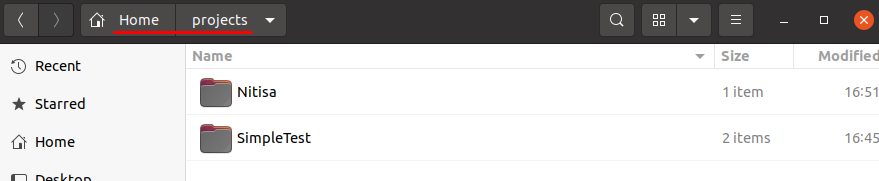
In the example above you can see that the project is copied to the home directory of the user you used when created remote connection in Visual Studio. As you may see from the window caption the project name is SimpleTest and thus the project is copied to ~/projects/SimpleTest directory. That is where the project source code is. Nitisa source code is also copied in the similar location of the same user. It is located in the ~/projects/Nitisa/[ver] directory, where [ver] is the version of installed Nitisa release. If you open file explorer on the Linux machine you can see something like following after building you project in the Visual Studio.
So now we know where all source code is. The compiled binary files are also there. By default, if you didn't change Linux project settings, the application binary file is located inside bin/[platform]/[configuration] directory and has the same name as the project has but with .out extension. That is all we need to know to setup debugging in Visual Studio Code. Lets do it.
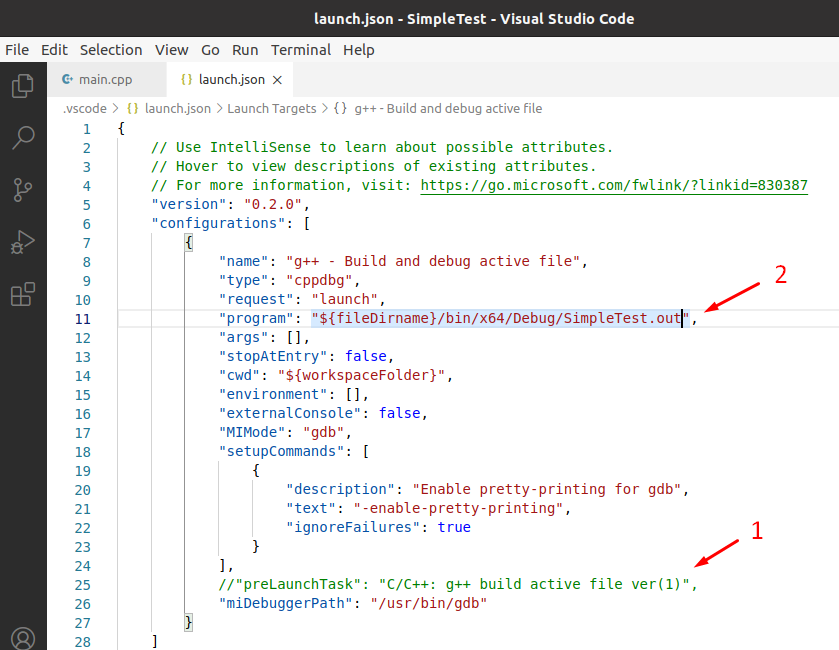
First of all you need to install Visual Studio Code and setup it as described in its documentation. Just follow the steps. You don't need any changes in tasks.json as you will build your applications from Visual Studio. When you get launch.json created, you need to do a little modification in it in order to debug your Linux application. First modification is to comment or remove preLaunchTask. This task builds source code. We don't need it as we already have everything built. The second and the final step is to modify program. This setting indicates binary file to be debugged. Change it so it points to the binary file of your application. In our example we've got this.
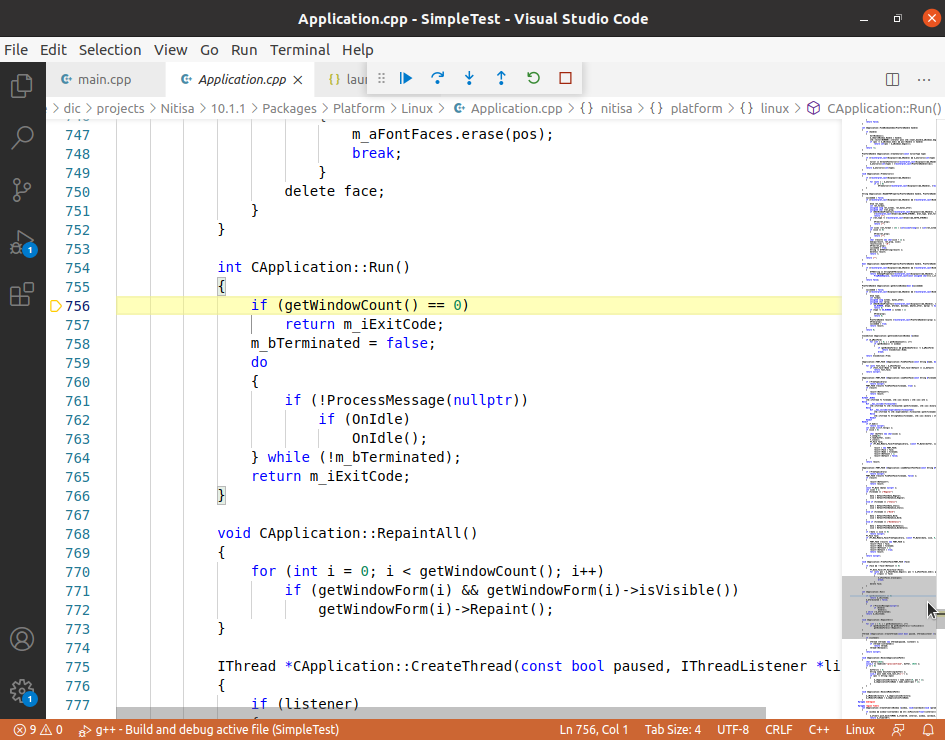
That is all. Now you can open your project's main.cpp (or anyone you have), set breakpoints and use step-by-step debugging. You even can go into Nitisa source code and debug it like shown below.
Lets make a summary of steps you need to perform to be able to debug your application under Linux operating system using Visual Studio Code.
- Open project in VS Code by typing
code .in terminal inside project directory. - Open main source code file of your project.
- Go to VS Code Terminal > Configure Default Build Task menu and select, for instance, C/C++:g++. It actually doesn't matter which build option you select as it won't be used.
- Close created
tasks.jsonfile. - Go to VS Code Run > Add Configuration... and then choose C++ (GDB/LLDB). You'll then see a dropdown for various predefined debugging configurations. Choose g++ build and debug active file. This will create
launch.jsonfile and might attempt to start building and debugging immediately and, of course, it will fail. It's Okay, just close error message. - In the
launch.jsonfile remove preLaunchTask line and edit program line so it points to the executable file of your application. - You can start debugging you application now.